
Content
- Odds ratios with 95% confidence interval
- Crude and adjusted odds ratios with 95%CI
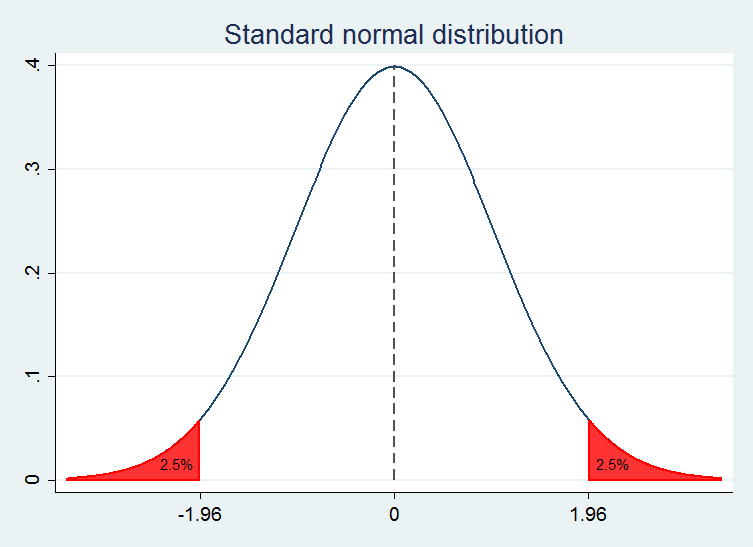
- Standard normal distribution
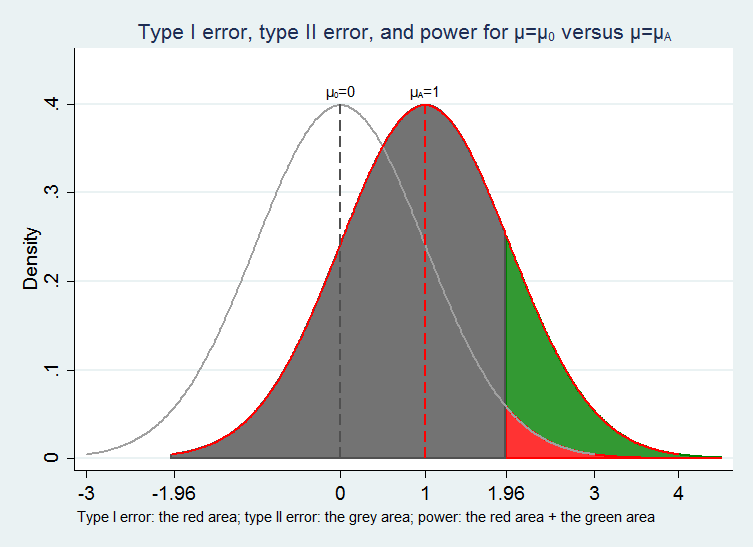
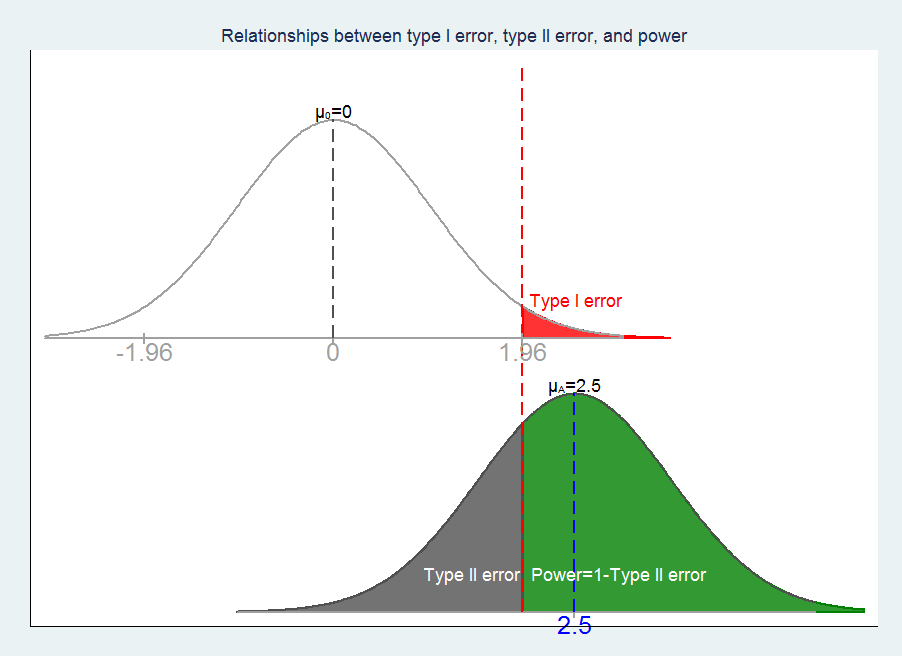
- Type I, II error and power (version 1)
- Type I, II error and power (version 2)
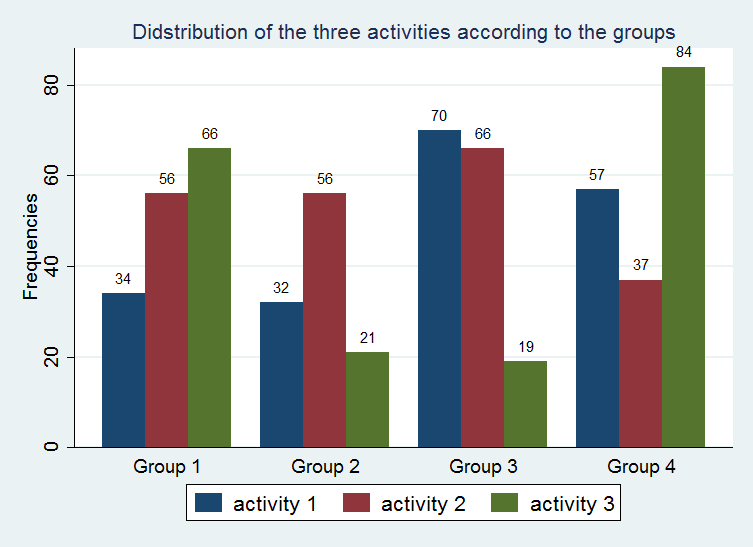
- Bar plot with frequencies
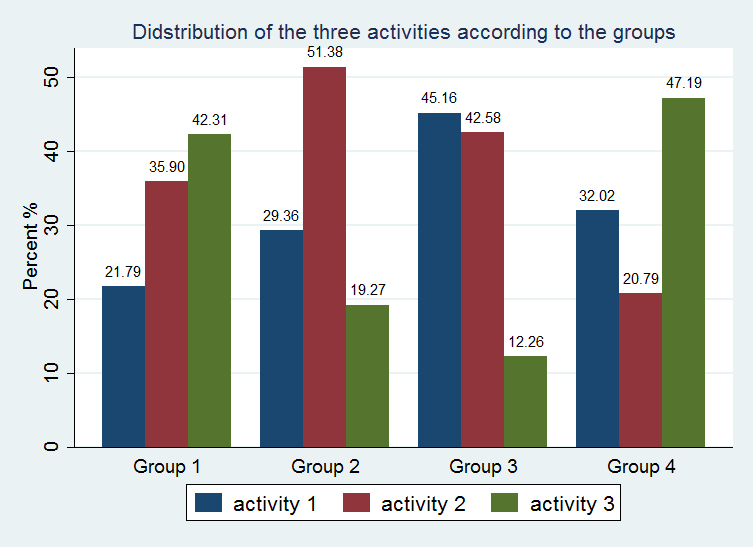
- Bar plot with percentages
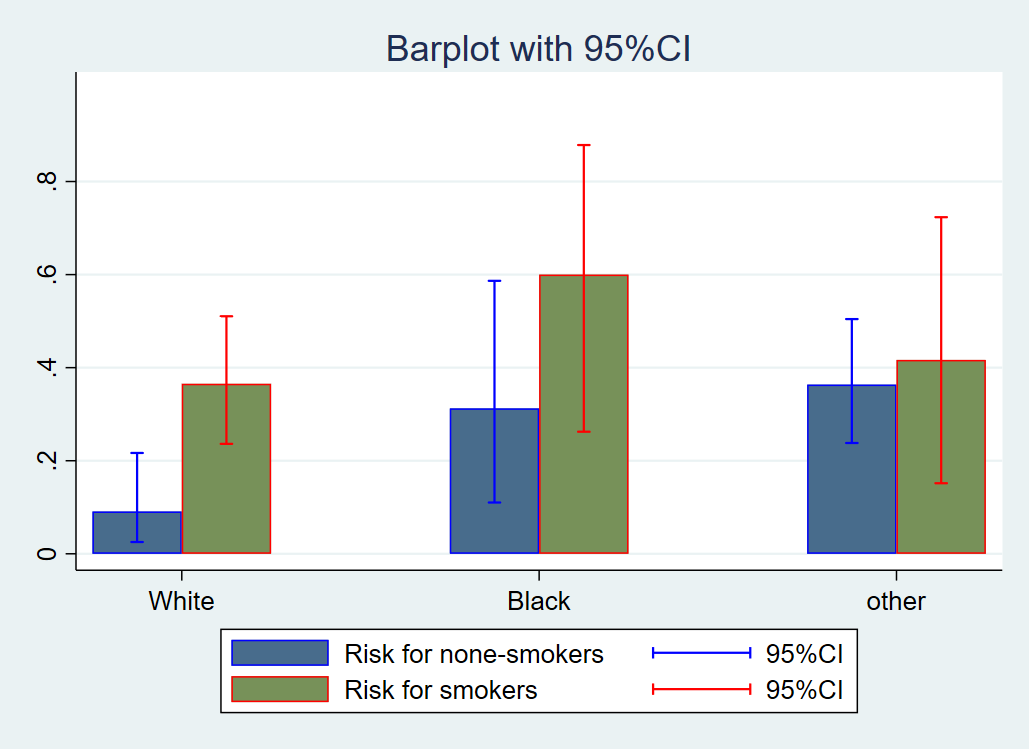
- Bar plot with 95%CI
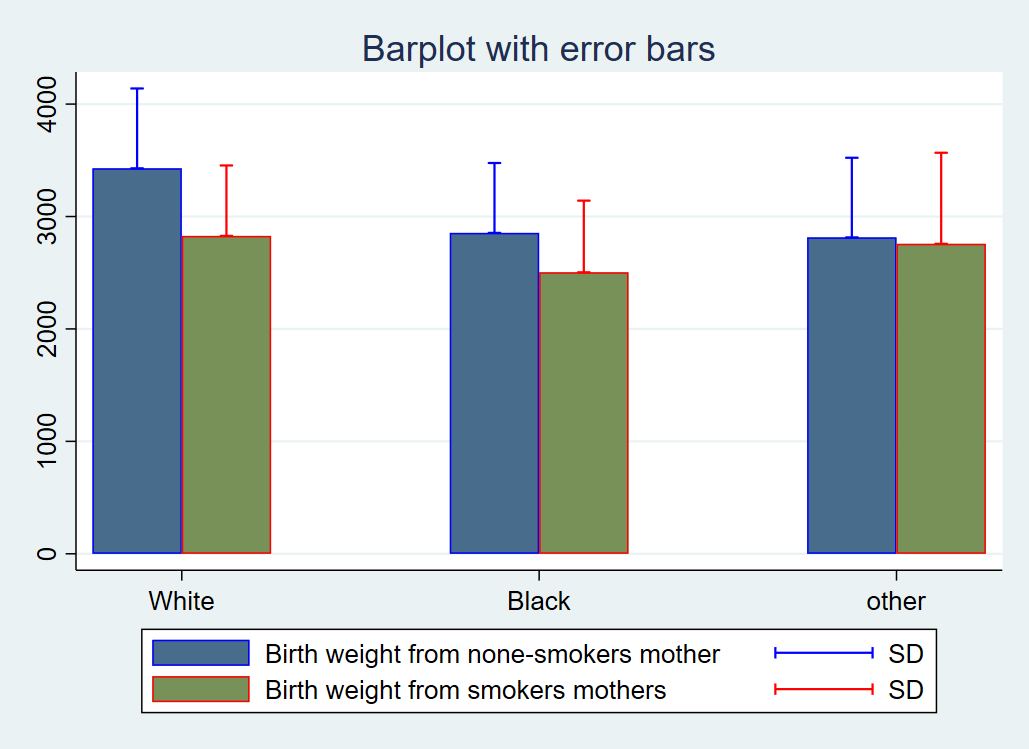
- Bar plot with error bars (Version 1)
- Bar plot with error bars (Version 2)
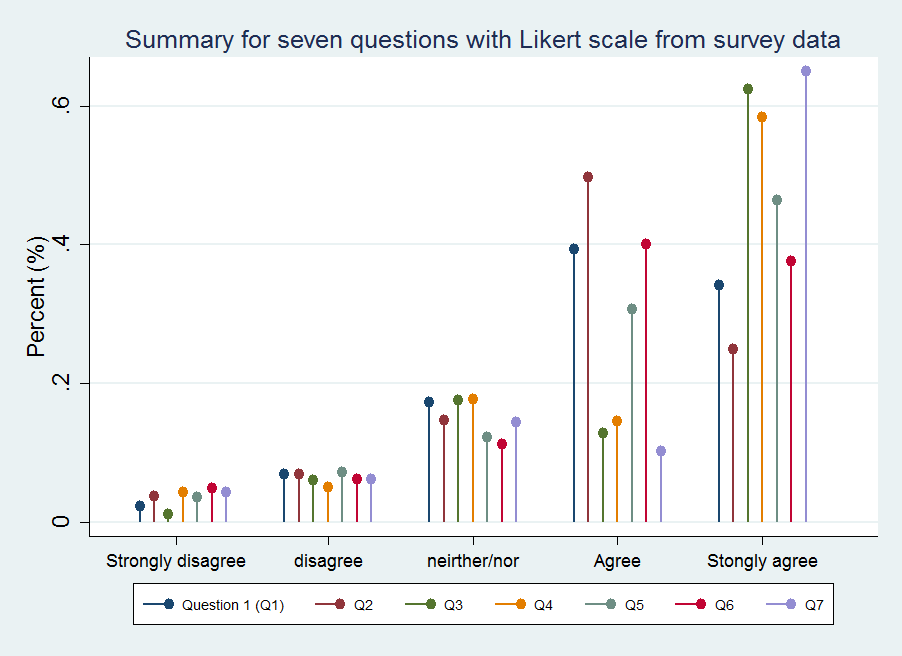
- Questions with Likert scale from survey data
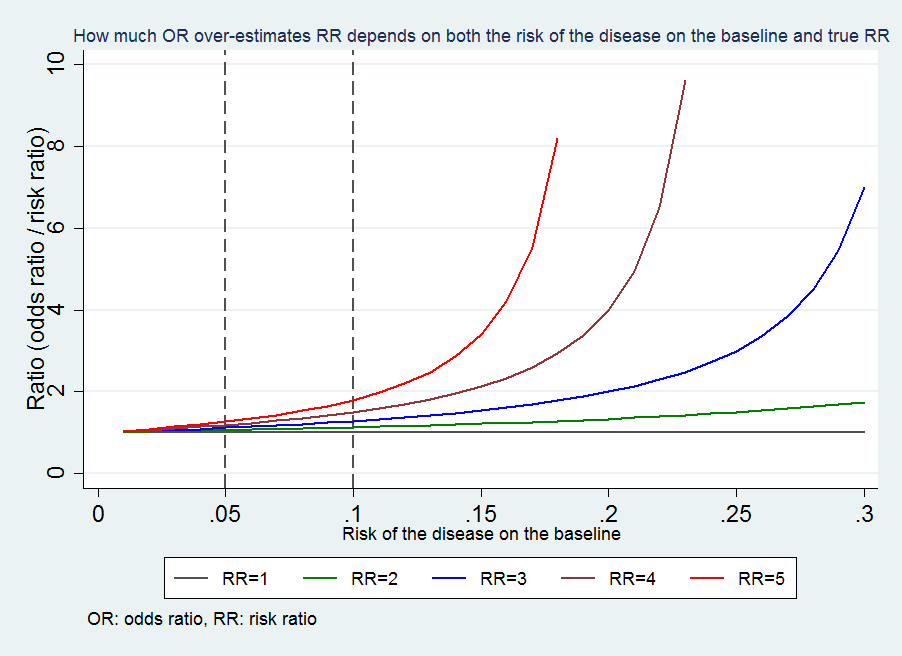
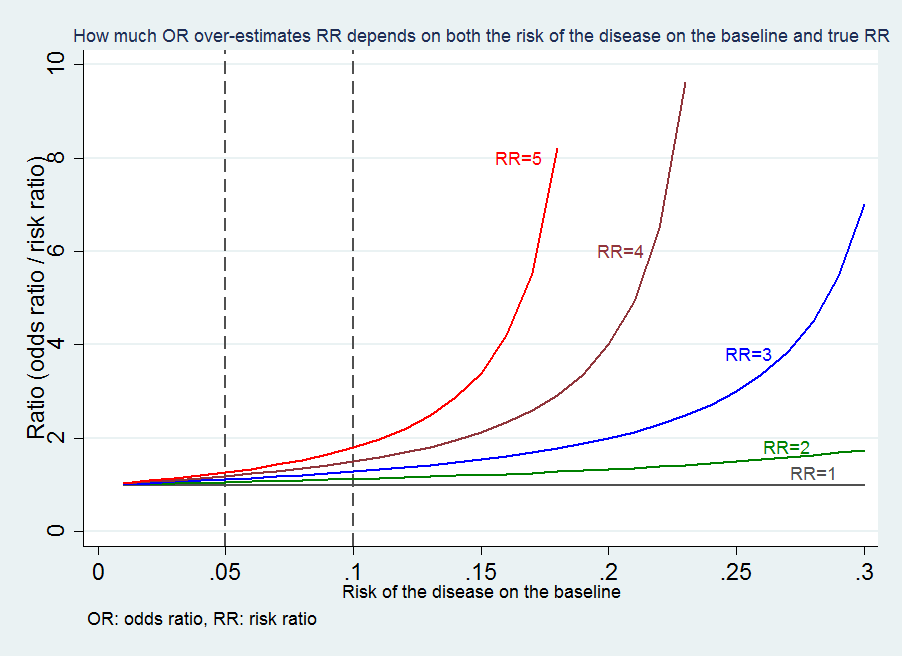
- Odd ratio over-estimates risk ratio (version 1-1)
- Odd ratio over-estimates risk ratio (version 1-2)
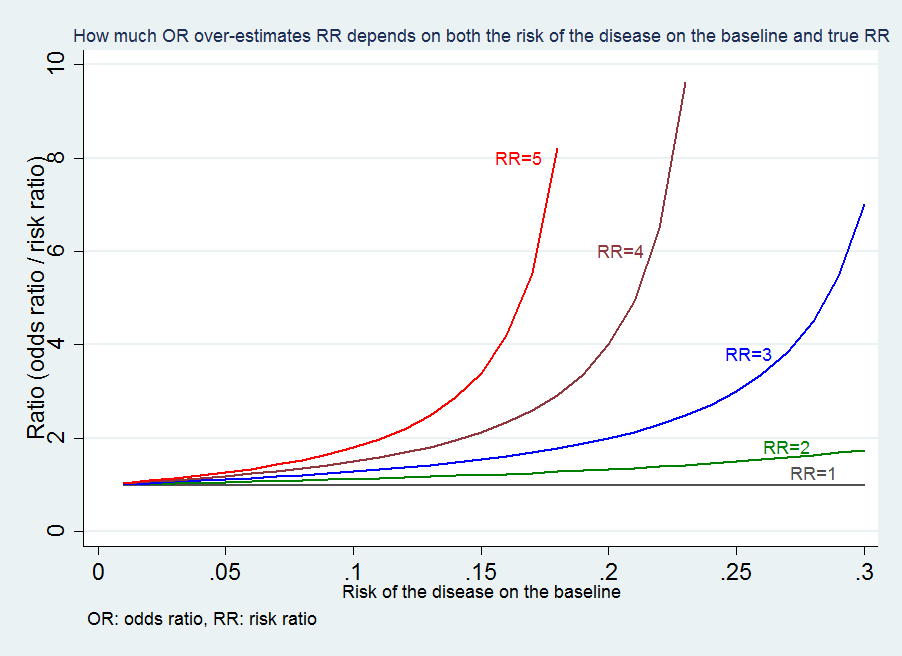
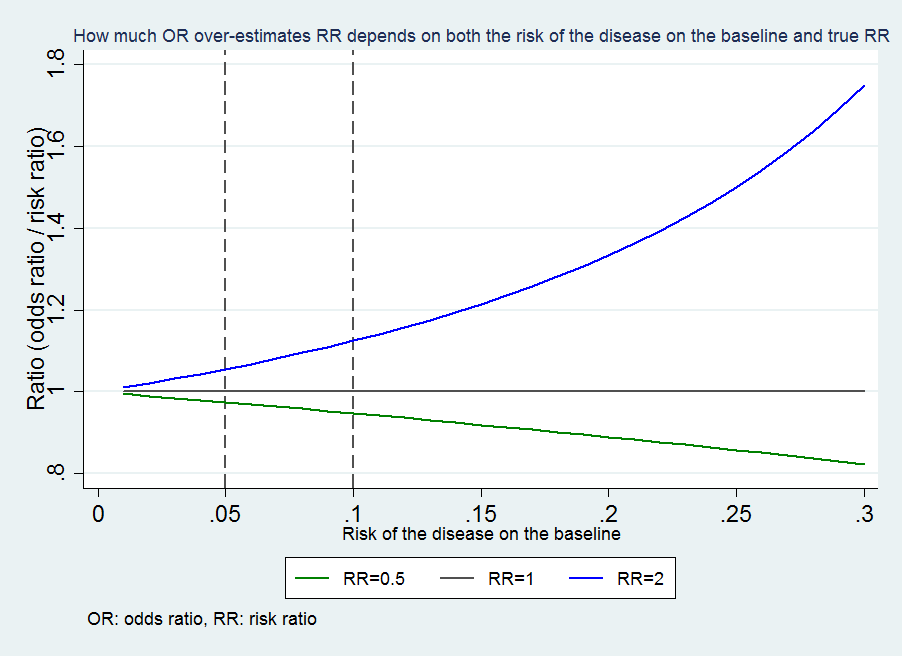
- Odd ratio over-estimates risk ratio (version 2-1)
- Odd ratio over-estimates risk ratio (version 2-2)
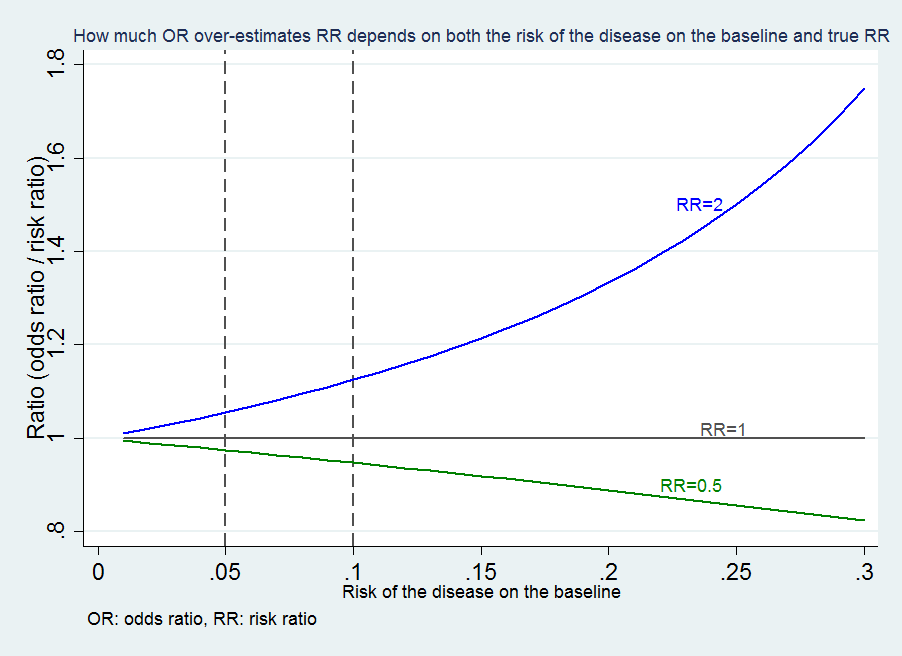
- Odd ratio over-estimates risk ratio (version 3-1)
- Odd ratio over-estimates risk ratio (version 3-2)
- Odd ratio over-estimates risk ratio (version 4-1)
- Odd ratio over-estimates risk ratio (version 4-2)
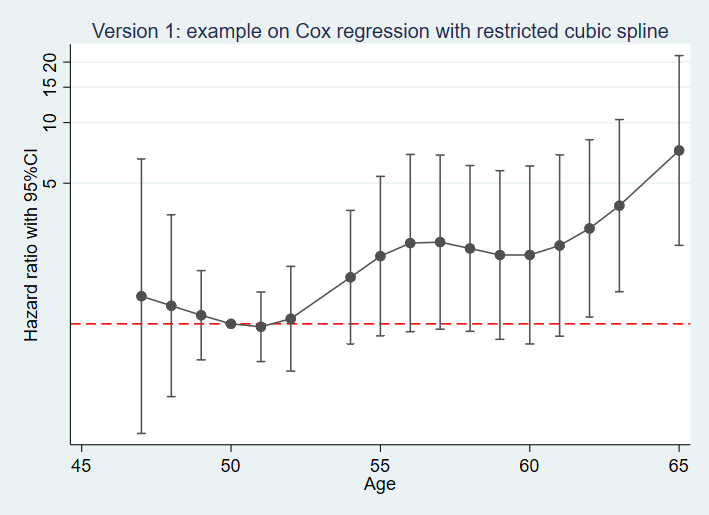
- Cox regression with the restricted cubic spline: version 1
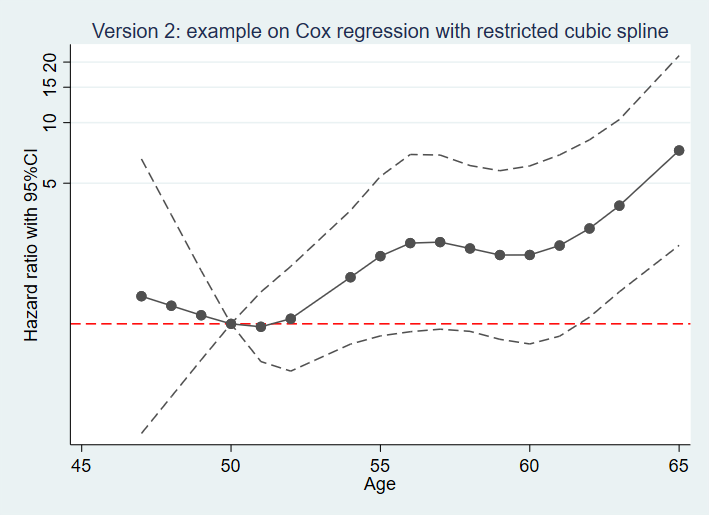
- Cox regression with the restricted cubic spline: version 2
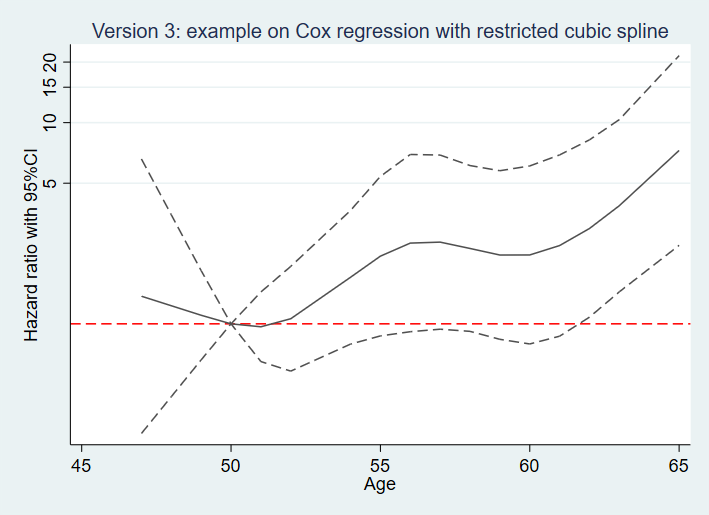
- Cox regression with the restricted cubic spline: version 3
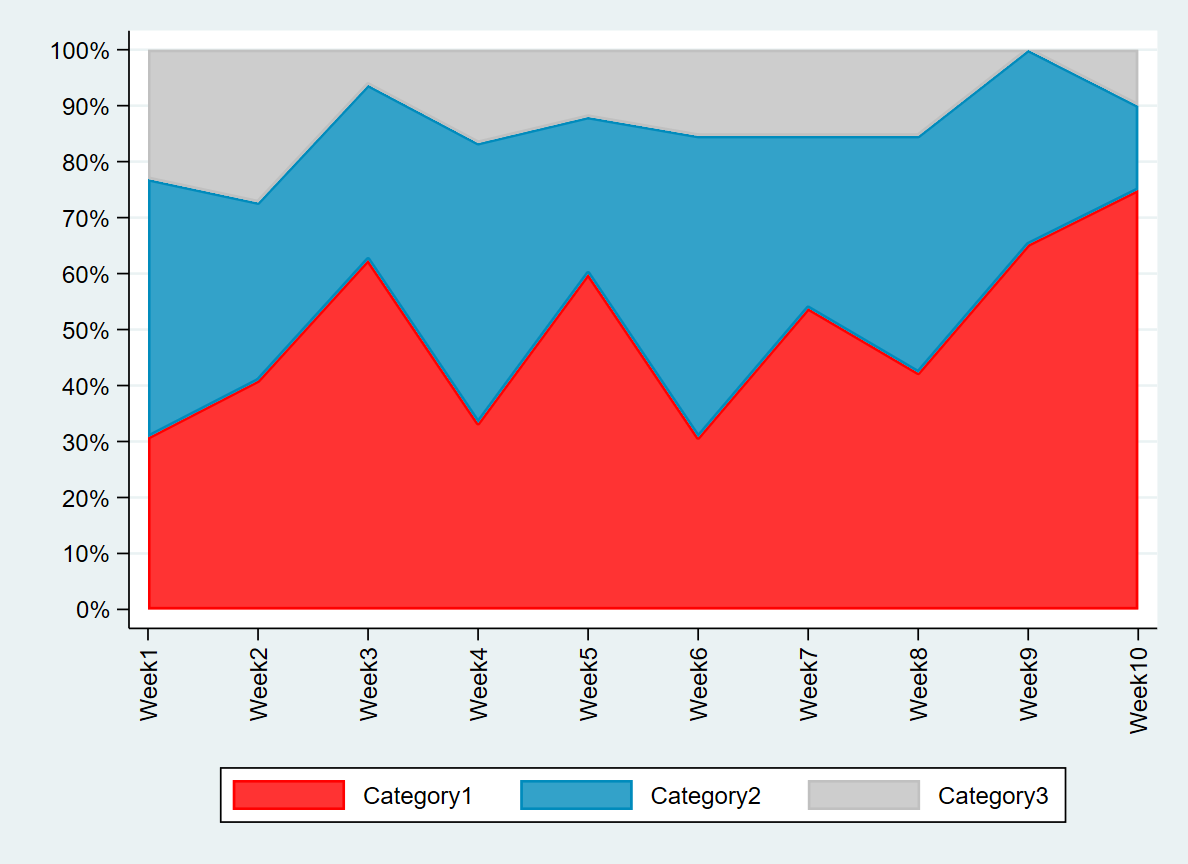
- Area for stacked percent/proportions
Odds ratios with 95% confidence interval
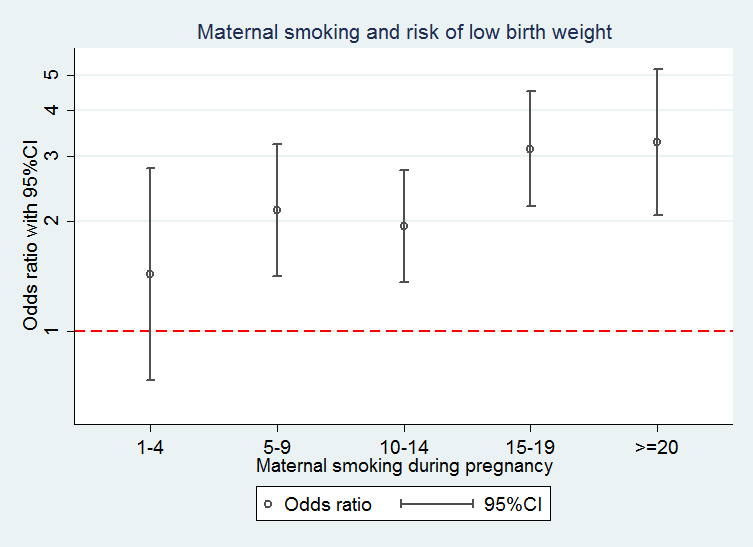
Be aware of that the graph neither reflect any scientific researches nor convey any scientific knowledge. We are focusing on how teachnically make the graph. All the titles and numerical values are purely hypothetical.
The technics can be applied to any regression coefficient such as risk ratio, prevalence ratio, hazard ratio etc.
You can view and download the Stata do.file to reproduce the exactly same graph.
Both crude and adjusted odds ratios with 95%CI
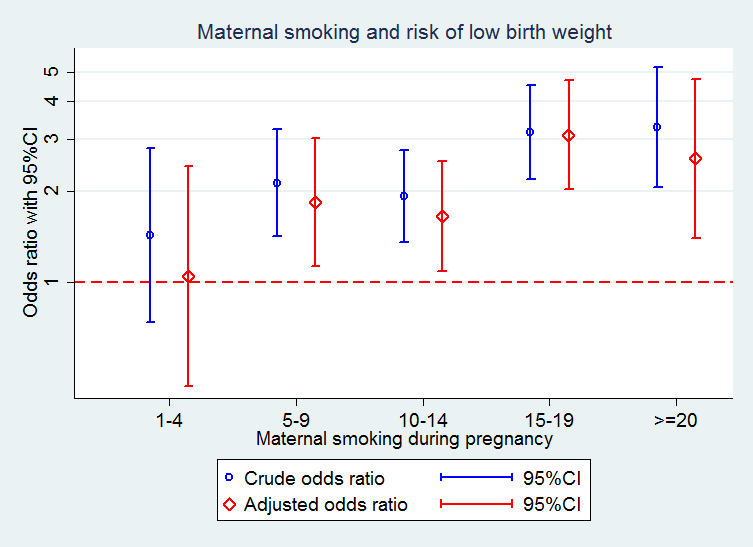
Be aware of that the graph neither reflect any scientific researches nor convey any scientific knowledge. We are focusing on how teachnically make the graph. All the titles and numerical values are purely hypothetical.
Bar plot with 95%CI


