A list of published books
After teaching some topics nearly for 10 years, you have collected quite a few very nice slides and great experiences in how to appropriately introduce the topics. If you truly believe some materials are much needed, useful, and beneficial, you are eager to share them with others instead of keeping them on your computer. To be available for those that need the materials, perhaps the best way is to publish a book that thoroughly introduces the topics. That is how the first two books came out.
An introduction to Directed Acyclic Graph (DAG) for health researchers
A new book “An introduction to Directed Acyclic Graph (DAG) for health researchers” has been published in Amazon
The book description:
"Directed acyclic graph (DAG) is increasingly used in modern epidemiology, especially guide researchers to implementing causal inference in observational studies. Casual DAG visually presents causal knowledge and assumptions between variables. Once one can manage the rules, it can facilitate many tasks, such as using DAG makes it easier to understand many concepts for example direct and indirect causal effects, mediation analysis, collider stratification bias, selection bias, and information bias, etc. It also makes easier to recognize and avoid mistakes in analytic decisions such as using the backdoor criterion to select variables to be adjusted."
"More advanced texts on DAGs are readily available in textbooks and in scientific papers, but a simple and comprehensive introduction to DAG is lacking."
"The book thoroughly introduces DAG in a plain language from the scratch, step by step with more simple and accessible language explaining the concepts, terminologies, rules, and potential applications. The book will pave the way for researchers using DAG."
A big picture of DAG
After years of teaching DAG, I have figured out a big picture (figure 2.2 in the book) illustrating how DAG works. The big picture of DAG has not appeared in any scientific articles or books. This is originally invent-ed/developed/formalized by researcher from Denmark.
Before DAG era
Before knowing DAG, as figure 2.1 in the book shows that we assume that we should theoretical-ly observe an association between an exposure and an outcome of interest if the exposure caus-ally affects the out-come as indicated by the arrow with the solid-black line form the causation to the association. When we ob-served an association between an exposure and an outcome, we wish to interpret the associations as causa-tion with potential biases induced by confounders, selection bias, and information bias which are listed in the up-right box. That is why an arrow with red-dashed line from association to causation.
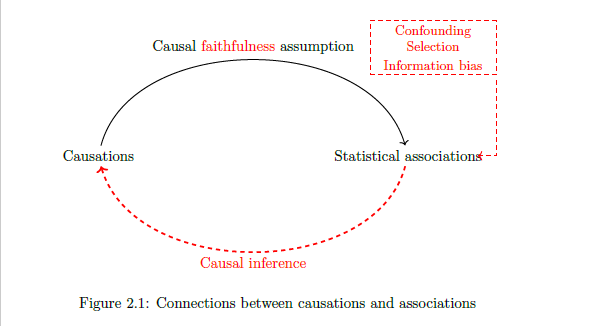
One of the challenges is how to choose variables to be adjusted in a multivariate regression. Before knowing DAG, it rarely describes how the adjusted variables are causally connected to the exposure and outcomes. We say that the adjustment is non-transparent and subjective at least from reader point of view.
DAG era
Selecting variables to be adjusted becomes super easy when a DAG is available. However, DAG can be an ab-stract concept and take a little energy to graph the rules. I have figured out a big picture of DAG (figure 2.2 in the book), which illustrates an overview of how DAG works.
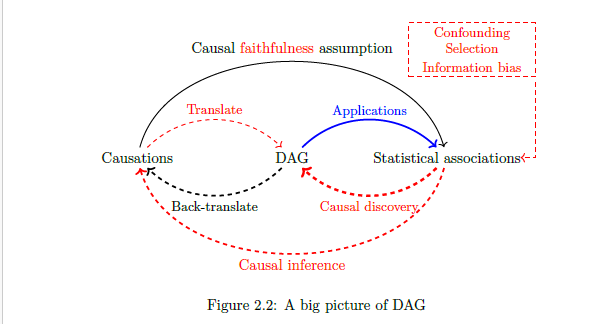
As the figure 2.2 shows, DAG concept can be viewed as the following 4 procedures. The colors and styles of the lines indicate relative difficulties. Briefly:
- Translate: translate knowledge and assumptions on causal relations between variables into a DAG.
- Back-translate: back-translate a given DAG to causal relations between the variables within the DAG.
- Applications: explain DAG terminologies, rules, and potential applications.
- Causal discovery: discover potential DAG reflecting the causal relations between the variables based on observed associations.
You may watch a short YouTube video YouTube: A big picture of directed acyclic graph
Contents
- Chapter 1 Graphical tools in general
- Chapter 2 A big picture of DAG
- Chapter 3 Translate
- Chapter 4 Back-translate
- Chapter 5 Dag applications
- Chapter 6 Causal discovery
- Chapter 7 Perspectives
- Chapter 8 Open thoughts
How to get started with Stata for beginners
A new book “How to get started with Stata for beginners” has been published in Amazon.
Book descriptions:
There are perhaps many excellent books and videos for advanced or intermediate Stata users. However, it is relatively rare for complete beginners.
As the saying goes, everything is difficult at the beginning. An entry-level textbook is far more important than we might think. The best entry-level textbook guides you start a topic smoothly and gives you confidence to go further. On the contrary, you might get confused at the beginning if an entry-level textbook is unsatisfied.
This book is based on 10-years experiences in teaching Stata to new beginners. Be aware of that the beginners here refer to those who has limited experience just in Stata. The beginners in Stata might either be young researchers who just embark their research career or be very experienced researchers but just new to Stata.
Most of the experienced researchers do not do data analyses themselves. But they need quickly understand their data and get summary statistics. You will be surprised that only ONE command or a maximum of FOUR commands are needed to reach the goals.
Young researchers not only need understand their data but also carry out data exploration, data management, data visualization, and data analyses.
No matter the experienced or the young researchers, this book has almost everything you need to get started.
This book first gives you an intuition that how Stata looks and how to communicate with Stata, afterwards shows you how to open a data and how to quickly get overview of the data. This part is probably all you needed for the experienced researchers.
Secondly, the book shows how to carry out data exploration, data management, and automatically create a descriptive table for the study population. Surprisingly, you only need to learn 10 commands to reach the goals.
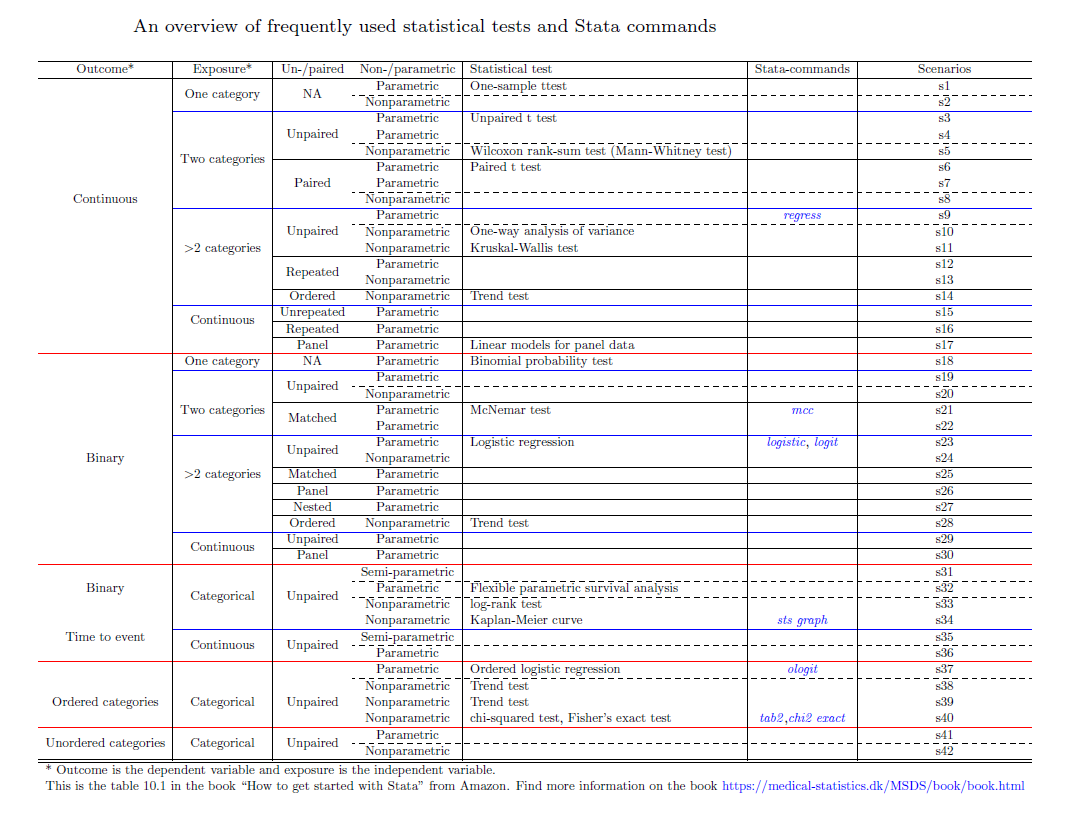
In practice, it is not easy to choose statistical analysis and identify appropriate commands. Final part of this book provides you with an overview of the frequently used statistical tests together with Stata commands and output. You will be inspired by the overview and get a systematic way to think about statistical methodologies.
Furthermore, the book gives you a taste of data visualization in Stata.
The book not only described the concept but also is companied with downloadable dataset and do-files that replicate almost everything presented in the book.
After going through the first part, the experienced researchers can quickly get summary statistics of their data. After going through the whole book, researchers learn the basic yet essential skills such as carry out crucial part of data management and get a hint of potential data analyses together with Stata commands and output.
All in all, this book will get you started your journey using Stata even for those have zero experience in Stata.
Contents
- Chapter 1 Introduction
- Chapter 2 Internal and external dataset
- Chapter 3 Use internal dataset
- Chapter 4 Explore the dataset
- Chapter 5 Import external dataset
- Chapter 6 Data management
- Chapter 7 List of Stata commands
- Chapter 8 How to get help for Stata
- Chapter 9 Automatically make a descriptive table
- Chapter 10 Overview 32 scenarios of statistical test
- Chapter 11 Graphs in Stata